Dashboard
Arrange a project's Dashboard tab of cards and charts — pin an assistant's dashboards to it, chart the project's events, follow the figures live, and write widgets through the API
A project's Dashboard tab is one grid of cards and charts, arranged by the people on the project for everyone who reads it. You fill it by pinning the dashboards the Dashboard Assistant builds, by charting the project's events, and through the API.
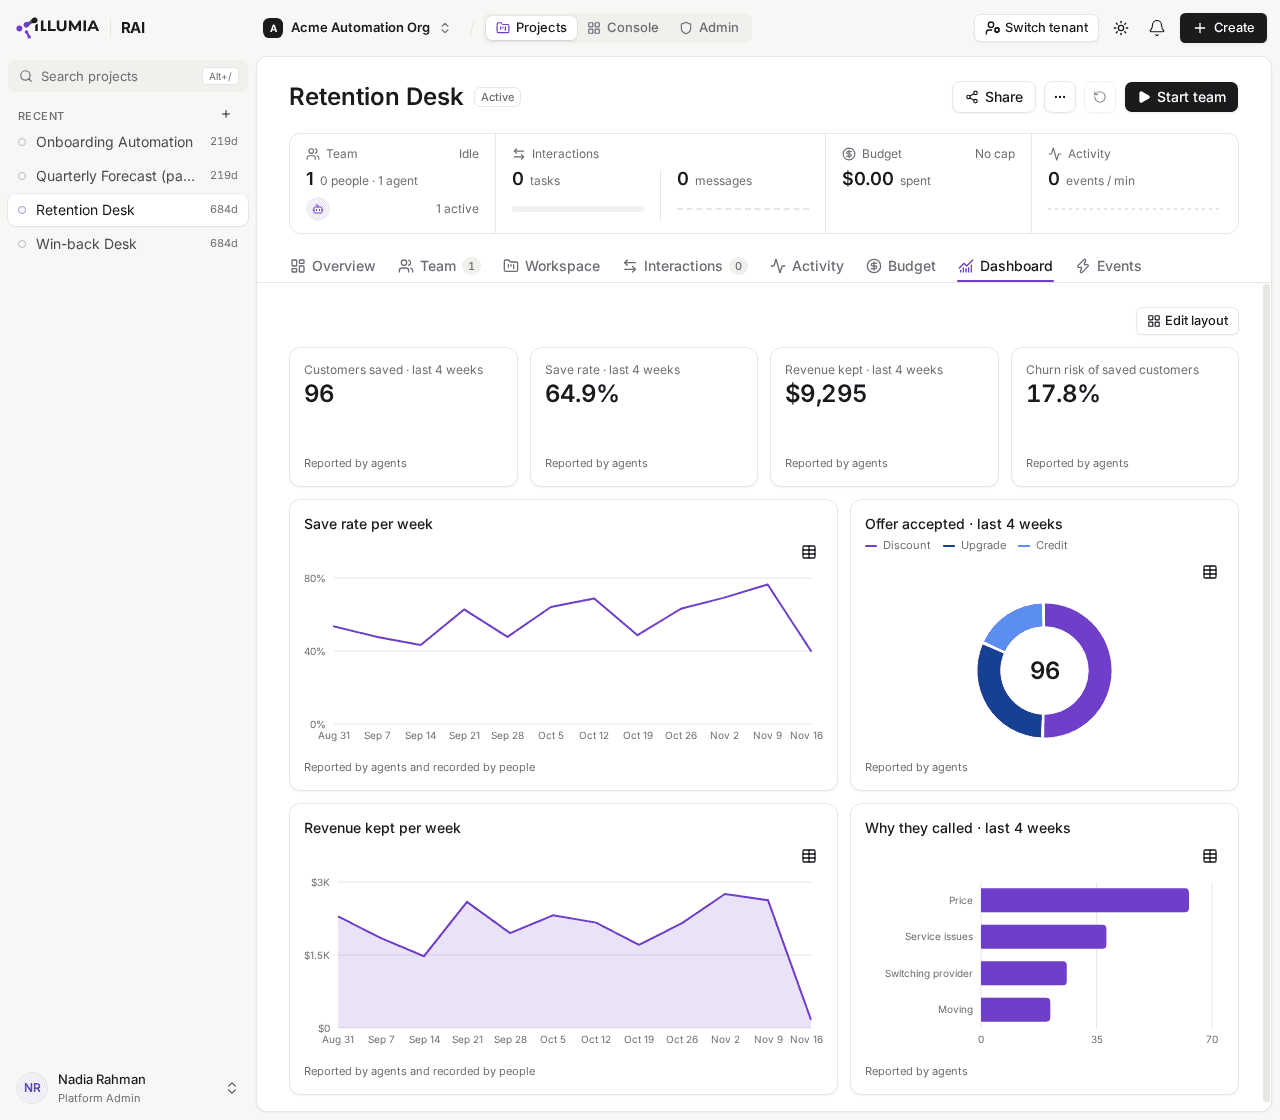
Here agents recorded the last four weeks and people the history before, so the four-week figures read Reported by agents and the weekly charts read both.
Reading the Dashboard
Each widget is a card holding one figure, or a chart: a line, area or bar chart over time, or a donut, pie or bar chart of a breakdown. A chart's button at its top right shows it as a table. On a narrow screen the widgets stack in one column, row by row, each row's widgets from left to right.
Under each widget a line says where its figures came from:
| Line | The figures are |
|---|---|
| Computed by RAI | AskRAI's own, computed from the project itself, such as its open tasks or its spend |
| Reported by agents | Computed from events the project's agents recorded |
| Recorded by people | Computed from events people recorded |
| Reported by agents and recorded by people | Computed from both |
| From a source, with As of a date | A third party's, as the system that wrote them through the API names it, and when they were read |
AskRAI computes every figure of its own, and every figure over the events, each time the Dashboard is read, so they are always current and never written by a model.
A widget whose figures can no longer be read says why instead, such as Its assistant dashboard is gone. or Its event query reads nothing: its event type may be gone. It stays where it is until someone removes it in Edit layout.
While the project has no widget, the tab reads No widgets yet and says how to add one.
A dashboard that follows the work
An open Dashboard tab follows the project with no reload. When an event is recorded, a widget charting its type reads its figures again within a few seconds, and so does a pinned piece whose figure rests on the project's tasks, its agents or its spend when those move. A figure reads again in place, so a chart you are hovering keeps its place. The Overview's pinned dashboards follow the work the same way.
Pinning an assistant's dashboard
A dashboard the Dashboard Assistant builds can be pinned to the Overview, to the Dashboard, or to both. Click Pin on its card in the assistant's chat, or in the dashboard itself, and choose:
- Pin to Overview — adds it as a card above the graph on the project's Overview tab.
- Pin to Dashboard — adds its pieces below the Dashboard's lowest widget: each of its figures as a card, side by side, then its trend as a line chart and its breakdown as a bar chart.
A place it is pinned to is checked in the menu, and the button reads Pinned. Choose a checked place to take it off: from the Dashboard, that removes every piece of it.
A pinned piece shows the dashboard's newest version, so a change you ask the assistant for appears on the Dashboard too. A piece the newest version no longer has, such as a third figure that a later version dropped, says so until someone removes it.
Arranging the Dashboard
Click Edit layout at the top right of the tab. Each widget gains a handle, its controls and a corner to resize from.
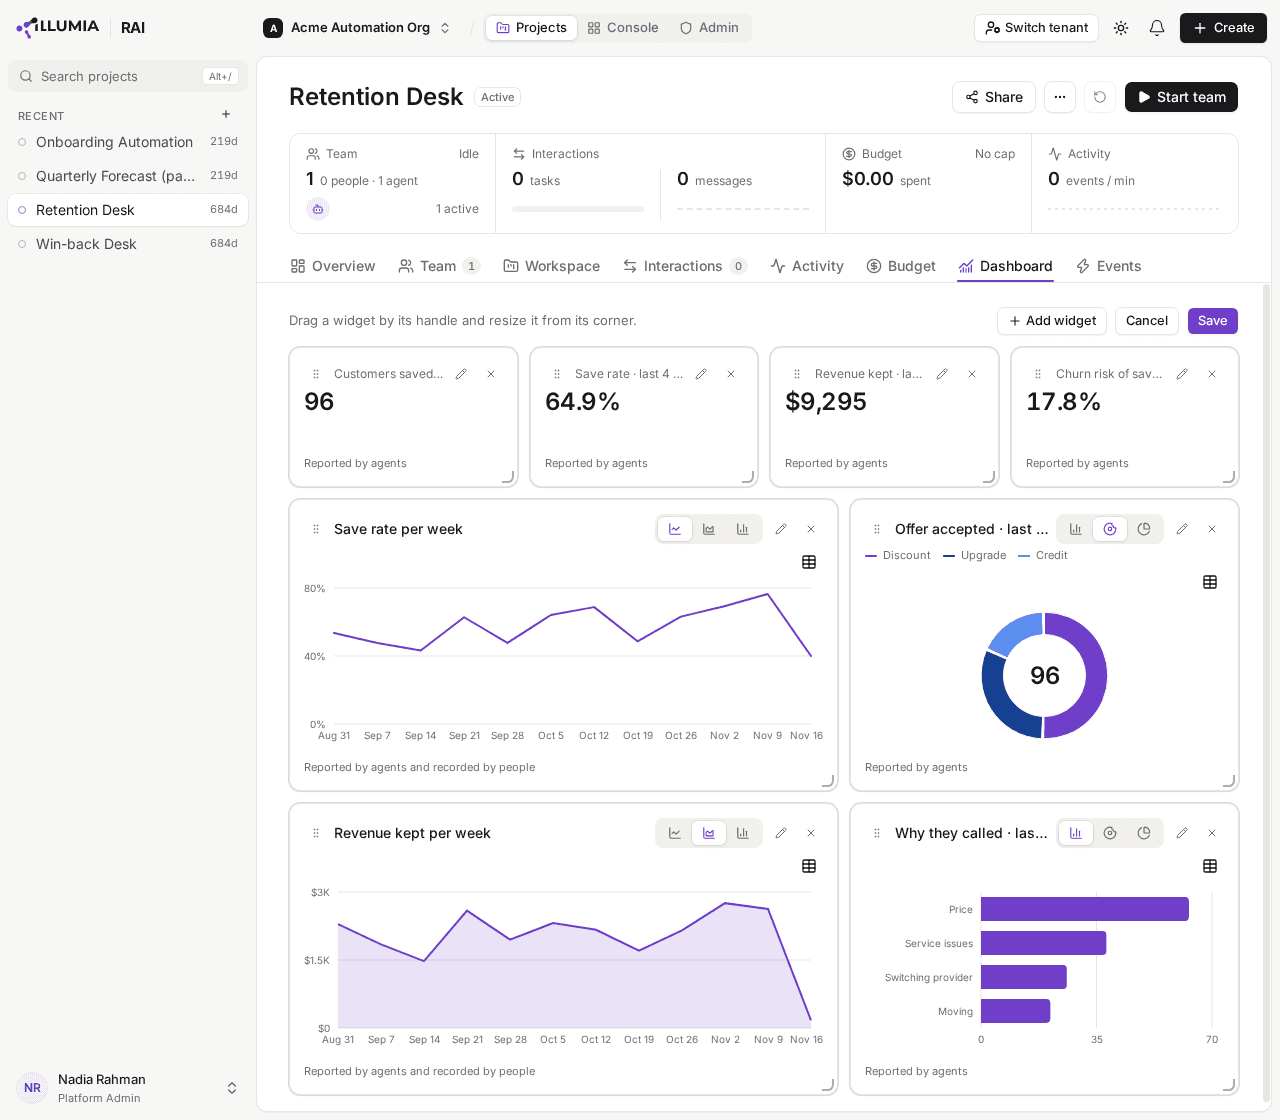
In Edit layout every widget can be moved, resized, switched to another chart, or removed; nothing changes for anyone else until you save.
- Move a widget by dragging its handle, at its top left. The widgets below make room.
- Resize it by dragging its bottom right corner. A widget spans 2 to 12 of the grid's 12 columns.
- From the keyboard, Tab to a widget's handle: the arrow keys move it, and Shift with an arrow key resizes it.
- Switch a chart among the charts its figures take: Line, Area or Bar over time, and Donut, Pie or Bar for a breakdown.
- Remove a widget with its ×.
- Add a widget over the project's events with Add widget, and change a widget built that way with its Edit (the pencil): see below. A pinned piece or a widget written through the API has no Edit.
Opening Edit layout moves widgets up to close any gap above them. Click Save to keep the layout for everyone, or Cancel to put it back as it was. Two people editing at once are not warned: the later save wins. A Dashboard holds at most 40 widgets.
Edit layout is offered on a screen wide enough to show the grid, and needs Write access to the project. Anyone with Read access sees Edit layout disabled, with a reason naming the Write access it needs. On an Archived project it is disabled for everyone.
Adding a widget over the project's events
Add widget builds a card or a chart over one of the project's event types, and shows its figure before you place it. A project that declares no event type yet is told to declare one on its Events tab first.
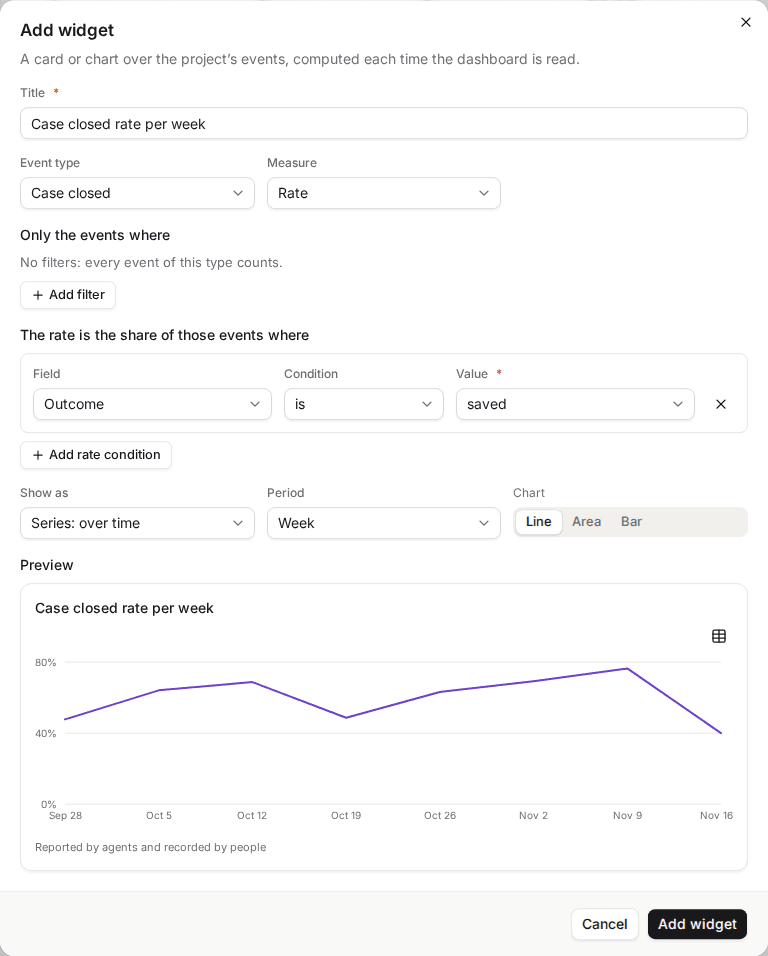
Add widget previews the figure as it would read, so only a widget you have seen is placed.
Choose the event type and the measure. Count counts its events. Sum, Average, Minimum and Maximum read one of its number fields, chosen under Of the field. Rate is the share of its events that meet a condition, as a percent.
Narrow it (optional). Under Only the events where, Add filter keeps only the events whose field is, is not, is more than or is less than a value, or is any of several. A rate's conditions go under The rate is the share of those events where: Outcome is saved makes a save rate. A widget takes at most 5 of each, holding at most 50 values in all.
Choose how it reads. Under Show as, Card: one number, Series: over time, by the Day, Week or Month you choose under Period, or Breakdown: by a field, ranked by a text, yes-or-no or choice field under Group by. A series or a breakdown takes the Chart you pick.
Title it and place it. Title follows your choices until you write your own, up to 120 characters. The Preview reads the figure once your choices hold still. Click Add widget: the widget lands below the lowest one, a card 3 columns wide and a chart 6. Save keeps it on the Dashboard.
A card or a breakdown reads the last 365 days, and a series its last 7 days, 8 weeks or 6 months. A retired event type is not offered for a new widget, and a widget already charting one keeps counting its events.
Writing the Dashboard through the API
A system of yours can put its own figures on the Dashboard: a card, a series or a breakdown it computes, beside the ones AskRAI computes. Calls go to the console's API, https://api.be.askrai.ai, with a person's console sign-in as the bearer token, as for recording events: there is no Programmable Access API key for these routes yet. Reading takes Read access to the project, and writing Write: a write with Read alone is answered 403.
| Route | |
|---|---|
GET /api/v1/projects/{project_id}/dashboard | Every widget with its layout, and who saved last |
PUT /api/v1/projects/{project_id}/dashboard | Replaces every widget at once, as Save does |
POST /api/v1/projects/{project_id}/dashboard/query-preview | Computes an event figure now and saves nothing, as Add widget's preview does |
PUT /api/v1/projects/{project_id}/assistant-dashboards/{dashboard_id}/dashboard-pin | Pins an assistant dashboard's pieces, as Pin to Dashboard does |
DELETE /api/v1/projects/{project_id}/assistant-dashboards/{dashboard_id}/dashboard-pin | Removes them |
PUT /dashboard replaces the whole Dashboard, so read it first, change the widgets you own, and send every widget back: one you leave out is removed. Drop each widget's reading before you send it, since only an answer carries it and a save that holds one is refused. The later of two saves wins.
{
  "widgets": [
    {
      "id": "3f1c9a2e7b5d4c8f9e0a1b2c3d4e5f60",
      "shape": "stat",
      "chart": null,
      "layout": { "x": 0, "y": 0, "w": 3, "h": 2 },
      "data": {
        "title": "Open renewals",
        "unit": "usd",
        "value": 48250,
        "detail": "across 31 accounts",
        "source": "Salesforce",
        "as_of": "2026-11-16T09:00:00Z"
      }
    },
    {
      "id": "8a7b6c5d4e3f20119a8b7c6d5e4f3a2b",
      "shape": "categories",
      "chart": "bar",
      "layout": { "x": 3, "y": 0, "w": 6, "h": 4 },
      "data": {
        "title": "Open renewals by tier",
        "unit": "count",
        "points": [
          { "label": "Premier", "value": 12 },
          { "label": "Choice", "value": 11 },
          { "label": "Entertainment", "value": 8 }
        ],
        "source": "Salesforce"
      }
    }
  ]
}idis 32 lowercase hexadecimal digits you choose, such as a UUID without its dashes, unique on the Dashboard.shapeisstat(a card),series(lines over time) orcategories(a breakdown). Itschartisnullfor astat,line,areaorbarfor aseries, anddonut,pieorbarforcategories.layoutplaces it on a grid of 12 columns:xfrom 0,wfrom 2 to 12 withx + wat most 12,yfrom 0 to 1,000, andhfrom 2 to 8 rows. A gap left above a widget closes the next time someone saves Edit layout.datacarries its figures, atitleof up to 120 characters and aunitofcount,usd,percent(0 to 100) ornull. Astatsetsvalue, a number or a short text, and may set adetailline under it. Aseriessetsseries, one to three lines of{label, points}over the same periods, oldest first, each point{label, value}, 60 at most.categoriessetspoints, up to 12, largest first.sourcenames where the figures came from andas_ofwhen, and the widget shows both.- A widget the console placed carries
ref(a pinned piece) orquery(an event figure) in place ofdata. Send it back as you read it, less itsreading, to keep it.
A save that breaks a bound, gives a shape a chart it does not take, or charts an event type or field the project does not declare is refused with 422, and changes nothing. One on an Archived project is refused with 409.
Troubleshooting
| Symptom | Likely cause | Resolution |
|---|---|---|
| Edit layout is not shown | The window is too narrow for the grid | Widen the window, or open the project on a larger screen |
| Edit layout is disabled, with a reason naming Write access | You hold less than Write on the project | Ask one of its Admins to share it with you at Write |
| Edit layout is disabled, and reads Project is archived — set its status to Active to change it | The project is Archived, so nothing on it changes | Edit the project and set its status to Active |
PUT /dashboard answers 422 naming reading | The widgets were sent back as GET /dashboard answered them | Drop each widget's reading before saving |
| Add widget says the project declares no event types | There is nothing to chart yet | Declare one on the project's Events tab |
| A widget reads Its assistant dashboard's newest version no longer has this piece. | A later version of the pinned dashboard dropped that figure | Remove the widget in Edit layout, or pin the dashboard again |
| A widget reads Its event query reads nothing: its event type may be gone. | Its query names a type or field the project no longer declares | Remove it, or rebuild it with Edit |
| An event chart has not moved | No event of its type has been recorded since the tab opened | Check the type's events on the project's Events tab |
| A widget you placed is gone | Someone saved the Dashboard after you without it, or a system replaced it through the API | Add it again; the later save wins |
| Add widget is disabled, and says a dashboard holds at most 40 widgets | The Dashboard is full | Remove a widget first |
Related pages
- Project Events — declare what the project records, and how agents and the API record it
- Assistants — ask the Dashboard Assistant for a dashboard to pin
- Projects — the Overview tab and its pinned dashboards
Interactions
Run a project's team of AI agents and people as a live, autonomous workspace — start and stop the team, exchange messages, manage a shared task board, watch activity, and approve agent proposals
Project Events
Declare the events a project records, let its agents record them as they work, record your own through the API, and chart them on the project's Dashboard